Data in the Atlas can support communities to:
Understand how children and young people are faring
Validate community concerns with robust, evidence-based data
Compare outcomes across different areas and communities
Identify priorities and opportunities for action
Monitor changes over time to understand the impact of programs and initiatives




Finding community level data
Watch this short video to learn more about selecting a location in the Atlas
Watch this short video to learn more about statistical areas
Community-level data refers to information that is small enough in scale to be relevant to a community. This differs from national or state-level data, which provides a broader, less localised picture. In the Atlas, data is presented using Australian Statistical Geography Standard (ASGS) boundaries, called Statistical Areas. More information about Statistical Areas can be found here.
Statistical Area Level 2 (SA2) is the smallest area shown in the Atlas. SA2 regions are useful for community-level data because it captures areas with smaller populations, on average, 10,000 people. This is often equivalent to a suburb or group of neighbouring suburbs. Where SA2 data is not available, larger geographic areas may still provide useful insights, including Statistical Area Level 3 (SA3), Local Government Areas, and Statistical Area Level 4 (SA4).
build a broader picture
Understanding community level data
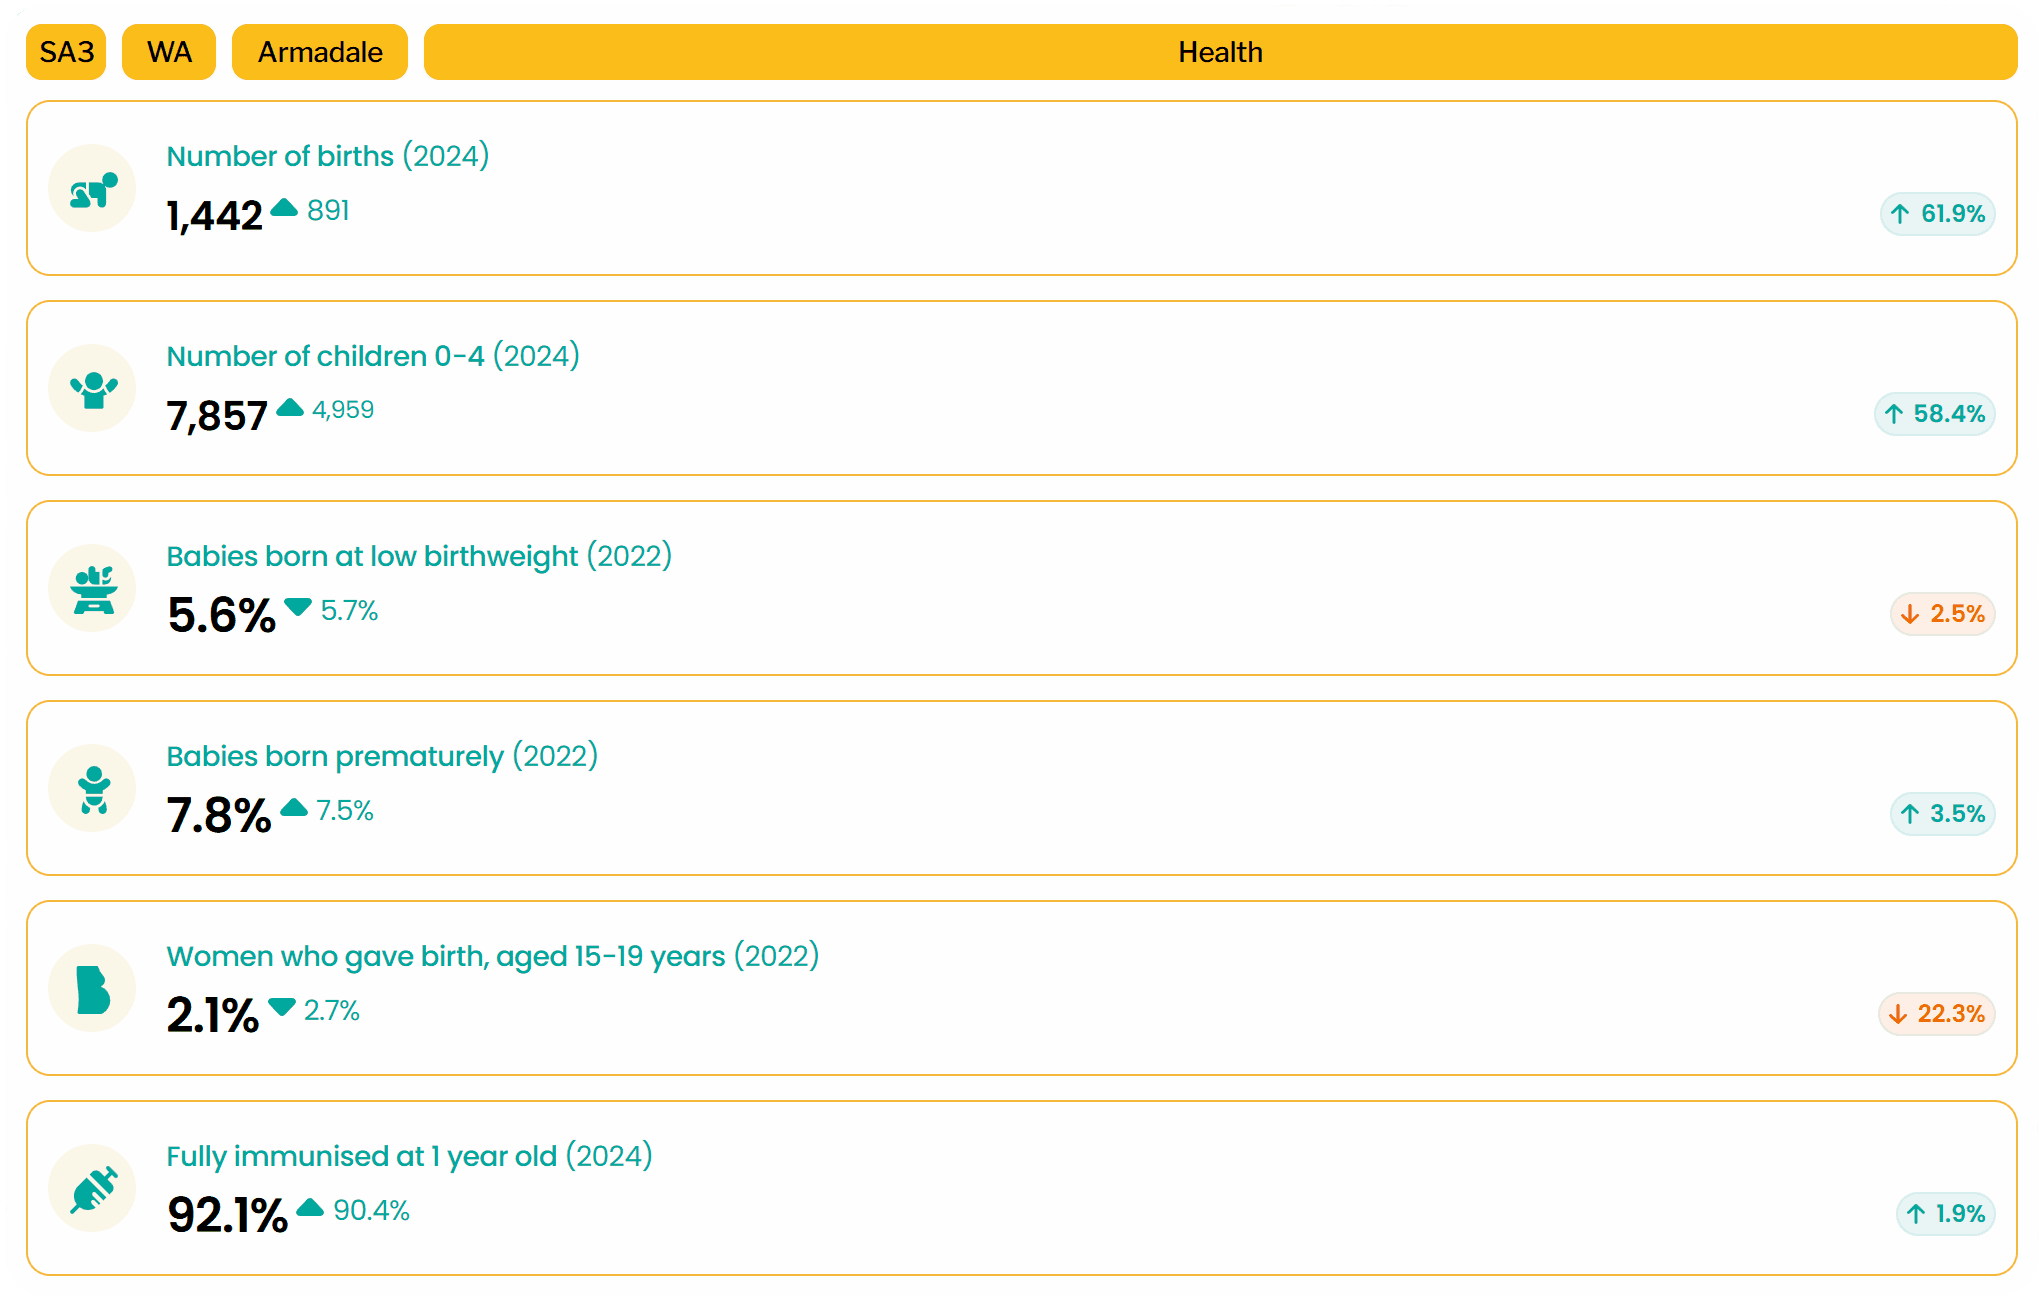
A helpful starting point is to build a broad contextual picture of children’s wellbeing in your area. The Atlas Data Snapshots provide a ready-made overview of a selected area at SA2, SA3 and Local Government levels.
Access the data snapshots here.
The Atlas maps include a range of demographic indicators to support this overview, such as:
Population growth: Number of births (how has this changed over time?)
Population characteristics: Number of children and young people, by single year of age or five-year age groups, and population projections (up to 2032)
Identity and culture: Country of birth, language, number of Aboriginal and Torres Strait Islander children and young people
The Atlas’ Service Layers function can also be used to overlay information about services in the area, adding further context to the data.
Explore the data
Constructing a research question

To meaningfully use and interpret community-level data, it is important to start with a clear research question. A strong research question clearly defines what you want to explore.
It might focus on:
an outcome you would like to see in your community
understanding experiences of children, young people and their families in your community
identifying local strengths and opportunities
setting community priorities
exploring how policies or programs have benefitted a community
Effective research questions are:
clear and focused
feasible (not too broad and not too narrow)
Researchable using available data
Aligned with a goal
Once your research question is established, you can use the Atlas filters to explore relevant datasets across seven themes:
Environment, Healthy, Learning, Material Basics, Identity and Culture, Participating, and being Valued, Loved and Safe.
TIe it all together
Using community level data
Community-level data is most useful when considered alongside related indicators to build a more complete picture. The examples below demonstrate how datasets can be used together to explore a research question. These examples show how indicators may be related, but they do not demonstrate causal relationships, as datasets may represent different populations or time periods.

Limitations of the data
Sometimes a direct indicator of an issue is not represented in the Atlas, particularly where information is not collected consistently, or collected in a way that cannot be mapped to small area/community levels. Data is also not always available for the latest year, as updates depend on collection and release schedules.
While data provides valuable insights, it can sometimes simplify complex social issues. Communities hold anecdotal evidence, local knowledge and lived experience that may not be reflected in datasets. The Atlas is designed to complement, not replace, this knowledge by providing accessible, evidence-based information to support decision-making.